Insight Machine

We help companies grow their profit margin.

We rebuild the portfolio and assortment, fine-tune prices and promos – on the basis of precise big-data analytics. This is how consumer-sector companies grow profit even in a declining market, combining decades of industry expertise with the speed of artificial intelligence.

Why now

Profit is under pressure, and the moment calls for renewed approaches.

We deliver more precise, better-grounded decisions on budgeting priorities for the commercial and marketing functions. In minutes the model finds patterns in your data and runs through thousands of scenarios, while experts test those conclusions against the reality of the market and make the final call.

Our answer

For every one of these challenges there is a specific tool.

Insight Machine brings scattered data into a single picture and answers every pain systematically – with ten RGM tools across three modules: where to grow, how to win and what is happening right now. All ten – on the right, and they work together, not separately.

10 RGM tools in one system
VECTORwhere to grow
1Demand growth segmentsWhere solvent demand is growing
2New-product prioritiesWhich launches to roll out first
3Brand role in the portfolioWhat each brand in the portfolio works for
4The roles of formats and packagingWhich pack creates profit
Read moreCollapse

We identify the largest, most promising demand clusters and rank them by how hard it is to win share in each: where entry is too expensive because of competition, where price pressure or dependence on weather, harvest and long supply chains hits profitability and risk.

We launch new products where you can claim the niche first, before competitors spot it – the first-mover advantage. We break down the portfolio: what creates margin and deserves focus, and what works as a “cost sink”. And we design the packaging architecture so each format builds margin without growing the budget.

TACTICShow to win
5Assortment optimisationWhat to drop from the assortment, what to scale
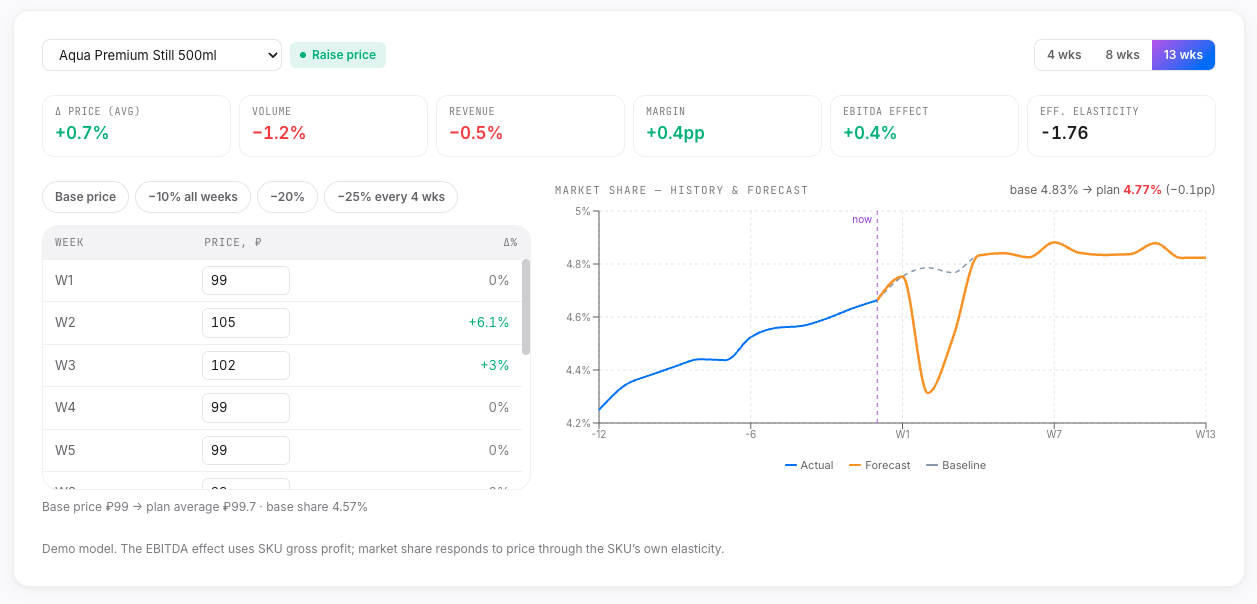
6Price elasticityWhere to raise price without losing sales
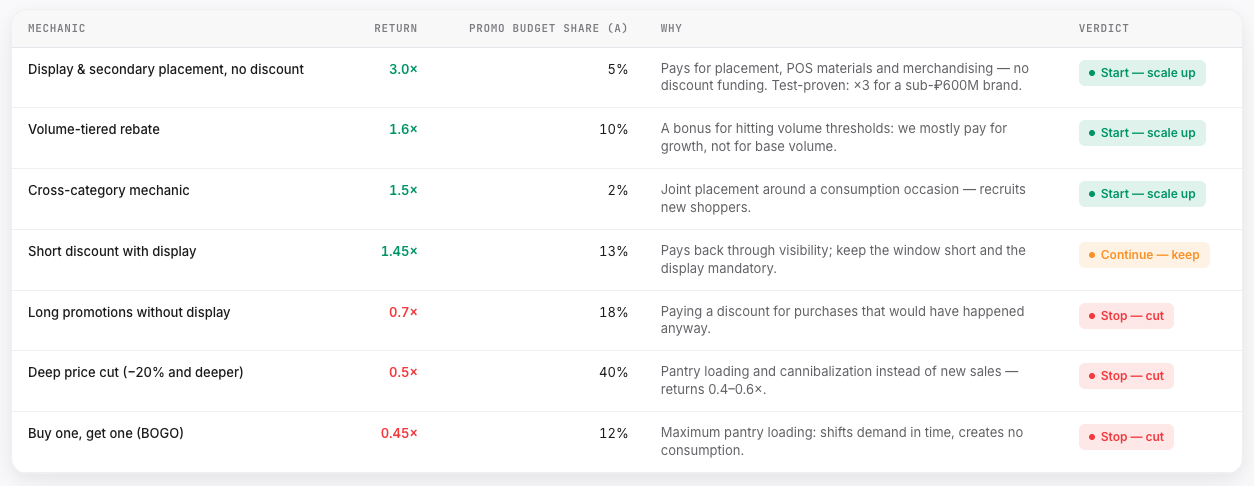
7Higher promo returnsWhich promotions pay off, and which don’t
8Channel and customer profitabilityWhich channels and customers bring profit
Read moreCollapse

This is where we decide how to extract profit from the chosen direction: we clean the assortment of loss-making items, fine-tune prices by elasticity, keep only promo that pays off and shift effort onto the channels and customers that truly bring in money.

PULSEwhat is happening
9Execution controlWhat went off plan – visible instantly
10Result driversWhy the result is what it is – root-cause analysis
Read moreCollapse

We bring together reports and analysis from different sources and departments of the company into a single whole and surface conclusions, contradictions and data that need attention or a second check.

The system tracks execution in real time, catches deviations within weeks rather than quarters, explains their causes and suggests corrections with clear targets for the team.

Insight Machine is modular

The tools and the order of their rollout are tailored to your task. You don't have to launch everything at once – start with a single tool and scale after the first result.

For example, an entry point – a single tool:
04
Assortment optimisation
ABC analysis of SKUs: what to drop, what to scale
05
Price elasticity
Where to raise price without losing volume
06
Higher promo returns
Which promotions pay off, and which don't
What is RGM

A strategic approach
to profitable revenue growth.

Revenue Growth Management (RGM) – an approach that unites a business’s marketing and commercial decisions in the name of profitable growth. It emerged about 50 years ago in the airline and hotel industries and by the 2000s became a standard in consumer goods (FMCG).

Implemented properly, RGM lets you grow revenue and market share over the long term, stay profitable even when demand falls or costs rise, and multiply shareholder capital.

Our focus – FMCG. The tools are built for consumer goods companies and adapt to retail and marketplaces. If you work in another industry – let’s discuss how it applies.

Learn more about RGM
What’s inside

How artificial intelligence and models turn your data into growth – and where the human fits in.

Let’s explain it in plain words, with no technical jargon. Growth comes not from “magic AI”, but from three layers that work together and do what neither a human nor an algorithm can do alone: artificial intelligence, models trained on your data, and expert experience.

Let’s start with the boring but important part. Your data on sales, prices, promo, shelf and shopper behaviour is usually scattered across different systems and reports. We bring it under one roof, clean it and put it in order. We take that on; you simply hand over the data as it is. And we don’t start every project from scratch: a ready-made core of proven commercial logic and tested algorithms helps reach the first conclusions faster and more accurately. And then comes the part that drives growth.

Artificial intelligence, the kind everyone knows from chatbots (large language models, LLMs), works like a polymath with a broad outlook. It assembles your scattered reports into a single picture, explains conclusions in plain language and points to what has already worked in other markets: the world’s best practices and trends.

But a broad outlook doesn’t calculate your profit. That is the job of machine learning (ML), a narrow specialist trained specifically on your data. Inside each tool it calculates precisely and concretely: where to raise price without losing sales (price elasticity), which promo actually pays off (promo returns), what really drives your sales (a multi-factor model, econometrics). With every data refresh it makes fewer errors.

These models not only explain the past, but also play out the future: what happens to profit if you raise price by 5% or shift the promo budget between brands. You compare scenarios and see the likely outcome before you invest. This is scenario modelling, and you can try it yourself.

And yet the final word stays with the human. The expert checks the calculation against the reality of the market and the context that doesn’t show up in the numbers, and turns it into a commercial decision the team is accountable for – not the algorithm.

Together these three layers deliver what you can’t get separately: you make decisions faster, see your business more clearly and get concrete steps, not just charts. And the heavy computation runs on your data inside a secure perimeter. We don’t pour your numbers into someone else’s chatbot.

The system is modular: you can start with one task (a single tool, brand or retail chain) and expand as data and business priorities grow. More in the “What we do” section.

In short

Artificial intelligence (LLM) connects context and explains it in plain language. Models (ML) calculate precisely on your data and show where different decisions lead. Experts turn this into decisions you can explain and defend before the retail chain, finance and the team. It is exactly this combination that gives the whole system its meaning.
Typical situations

Where companies
lose profit.

Four pains we come across most often. If you recognise your business in even one – let’s talk.

01

Demand grows, profit – doesn’t.

The company operates in growing categories, but margin can’t keep pace with volumes. Underneath – skews across demand segments, growth in unprofitable items.

02

Discounts eat the margin.

Promo and trade investment grow year on year, while their contribution to profit – falls. There’s no understanding of which activities pay off and which drag things down.

03

Decisions are made too late.

Market signals – a drop in a channel, a new competitor, a shift in shopper behaviour – are noticed after 3–4 months – by which point the train has already left.

04

Every department optimises its own thing.

Marketing grows brand awareness, sales – distribution, finance – margin. Separately, everything looks fine. Together – money is lost between departments.

Where it helps most

Where Insight Machine
is especially useful.

Nine typical business situations. For each – what we do, what it gives your team, and the analytics working under the hood. Tools are assembled around your task.

01

If the market has shifted and strategy needs a rethink

Demand growth segments New-product priorities Brand role in the portfolio

We analyse market facts and trends, identify the most promising growth segments, assess the potential of new products, and adjust the role and price positioning of each brand in the portfolio – to focus investment where it can create the greatest effect.

IM10 automates most of the analytical work – the team focuses on making decisions rather than preparing presentations.

Under the hood

Market trends and market-size forecast, competitor analysis and their moves, best practices from other countries in the category, identification of promising segments (channel, geography, product, pack, price tier), new-product potential assessment and prioritisation, brand-health and result-driver analysis.

02

If you need to raise profit per unit sold

Assortment optimisation Price elasticity Higher promo returns Channel profitability Result drivers

We quantify the impact of price, assortment, promo activity, sales channels, competitor behaviour and external factors on volume, revenue and profit – to show which decisions actually work.

Instead of weeks of manual analysis, specialists get ready conclusions and can test far more scenarios in the same time. The scenario-planning tool supports an informed choice between actions.

Under the hood

Price-elasticity model by SKU, multi-factor volume-impact model (econometrics), ABC analysis, promo-effectiveness analysis, channel and customer profitability analysis, scenario modelling (“what if”).

03

If results aren't coming and urgent corrective action is needed

Result drivers Execution control

We combine data from different departments and external sources into a single system for root-cause detection and decision support.

This removes a large amount of manual report preparation and significantly cuts the time between data arriving and a decision being made.

Under the hood

Analysis of growth and decline drivers (decomposing the impact of price, promo, assortment, distribution and competitor moves), monitoring of market and competitive changes, key-KPI monitoring, recommended responses, scenario modelling (“what if”).

04

If costs are rising and prices need to go up

Price elasticity

We build a price-elasticity model, propose several pricing scenarios and show the expected impact of each option on sales volume, revenue and profit.

The model calculates automatically, lets you quickly recompute new scenarios without redoing the analysis, and raise prices sensibly, with minimal losses.

Under the hood

Price-elasticity model (by SKU, region, channel and store format), multi-factor volume-impact model (econometrics), scenario modelling (“what if”).

05

If the promo budget is growing and activities need to be more effective

Higher promo returns

We determine which promo activities create additional profit and which merely increase sales volume with no economic effect.

This helps reallocate the promo budget to genuinely effective mechanics and raise return on investment.

Under the hood

Promo-effectiveness analysis, price-elasticity model, multi-factor volume-impact model (econometrics), scenario modelling (“what if”).

06

If the assortment is growing uncontrollably and needs optimisation

Assortment optimisation

We show which SKUs strengthen the portfolio and have growth potential, and which reduce its efficiency – and prepare assortment-optimisation recommendations.

IM10 reduces the amount of manual analysis and lets you make portfolio decisions faster.

Under the hood

ABC analysis of existing SKUs, new-product potential assessment and prioritisation, growth- and decline-driver analysis.

07

If you need to improve channel and customer profitability

Channel and customer profitability

We assess the profitability of customers and sales channels and factor in their development prospects – to determine where it makes sense to direct investment and the team's effort.

Managers get a transparent picture of performance without collecting data manually from many reports.

Under the hood

Channel and customer development forecast, P&L analysis and comparison across customers, competitor-action analysis.

08

If you need to raise the efficiency of the analytics team

All 10 tools

IM10 automates data preparation, calculations and a significant part of the analytical work. Specialists spend more time finding solutions and growing the business instead of preparing reports and presentations. The system provides a single, structured approach to data – no significant source is missed.

If the company faces the need to cut payroll costs, solutions like IM10 help go through this with lower risk to the business – improving the speed and quality of work.

09

If you need an immediate profit effect with minimal risk

Pilot on a single tool

You don't have to launch a big project and all 10 tools at once. You can start with one tool, one business question, one category, brand or retail chain, get the first result in a few weeks, and then decide on scaling.

Any of the ten IM10 tools can be launched as a pilot. Or we'll assemble a custom set of tools around your business task.

Why us

Science + Art
in one loop.

Most offers on the market solve only part of the task: either strictly technical, or strictly expert. Insight Machine combines both.

Science
Clarity of data.

Every calculation is transparent, reproducible and grounded in real data – not in guesswork and gut feel.

  • A single pipeline from raw data to a finished decision. No prompts, no manual recalculations.
  • A self-learning model that gets more accurate with every iteration.
  • Scenario modelling across price, promo, assortment, channels - with a forecast for margin and operating profit (EBITDA).
  • Real-time signals: deviations are visible before they turn into lost share.
  • Scientific advisor: an Oxford PhD in machine learning and statistics, practising in Big Tech – validates the models.
Art
Expert market knowledge.

30+ years in the industry. A sense of context no algorithm can replace.

  • Experts at the intersection of machine learning, RGM and marketing - a tight-knit team, possibly the only one on the market.
  • The “Staff HQ” as a methodology for syncing functions around shared priorities.
  • A green corridor for quick decisions: impact × effort, without drawn-out sign-offs.
  • A contribution to P&L, not decks full of recommendations for the sake of decks.

Why other approaches don’t work.

Consulting
Slides without implementation

They give recommendations and leave. Execution stays with your team. Timeline – at least six months, result – a deck.

BI systems
Data without decisions

They show numbers and charts. What to do with them – a human decides, and that takes time. No self-learning, no reproducibility of processes.

AI teams
Models without the business

They can build models, but don’t understand the industry. They speak a different language from the business teams, and need a translator.

RGM teams
Expertise without automation

Strong in commerce, but without machine-learning engineering and automation. Speed limited by human resource.

Your RGM team – without hiring people or building it from scratch.

Ekaterina Aleksandrova Anastasiya Merezhko Mikhail Ionitsa Fyodor Bachkala Georgiy Bachkala
Team
Decades of practice in strategy, marketing and RGM. Marketing and RGM at Coca-Cola, InBev. Data Science at Nestlé, Barclays, Expedia. PhD Oxford.
Five experts at the intersection of RGM, marketing and Data Science.
Meet the team →
?FAQ